Related Category
Business Type

30 - 40 /Kilogram
A.J. Patel & Sons

25 - 30 /Kilogram
SandMartin Exports Private Limited
20 - 50 /Kilogram
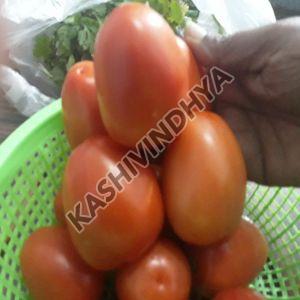
Kashivindhya Agro Farmer Producer Company Limited
50 - 80 /Kilogram
AK International Exporter And Importer

50 /Kilogram
Good Hope Exports

45 - 60 /Kilogram
Neolog Corporation

15 - 50 /Kilogram
N B AGROSOFT PRIVATE LIMITED

30 - 40 /Kilogram
Grace Enterprises
60 - 200 /Kilogram
Sarthak Trading Company

100 - 150 /Kilogram
Transit Exim International
30 - 50 /Kilogram
Shubham Export

20 - 30 /Kilogram
HR Exports

Get Quotes from Verified Suppliers


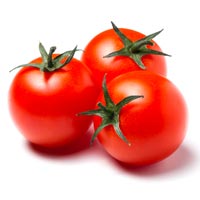
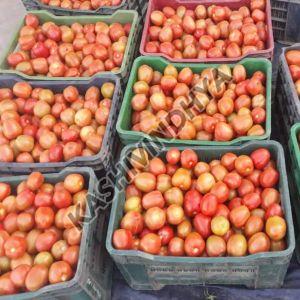
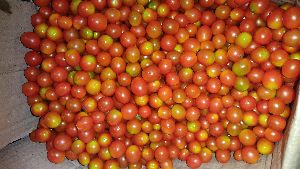
You get tomatoes at a minimum rate of Rs 10-15. The price will increase as per the quality and variety of tomatoes.
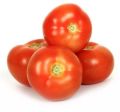
Tomatoes are mainly categorized under A-grade, B-grade, and C-grade. The price of tomatoes varies as per quality.
• The price range of A-grade tomatoes is from Rs 12 to Rs 60.
• The price range of B-grade tomatoes is from Rs 10 to Rs 55.
• The price range of C-grade tomatoes is from Rs 5 to Rs 30.
The price range of tomatoes as per their color is mentioned below:
|
Tomato Color |
Price Range in Rupees |
|
Yellow |
Rs 9-15 per Kg |
|
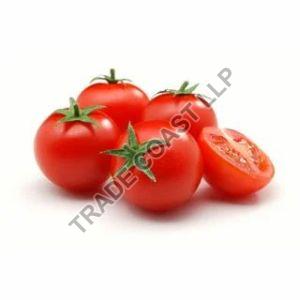
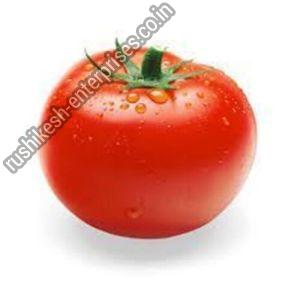
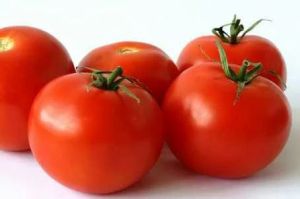
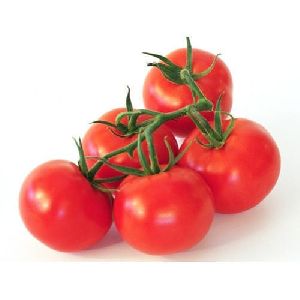
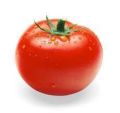
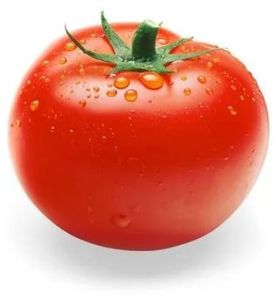
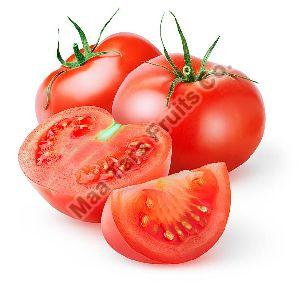
Red |
Rs 12-60 per Kg |
|
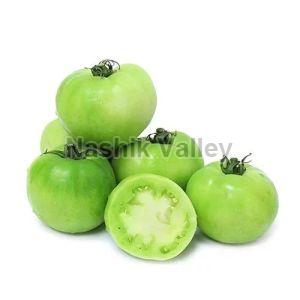
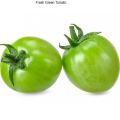
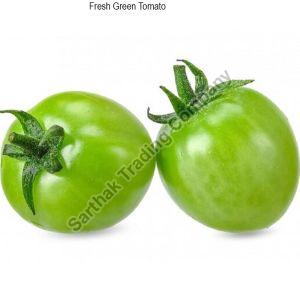
Green |
Rs 11-30 per Kg |


Get Quotes from Verified Suppliers
| Rank | Country | Production in tonnes |
| 1 | China | 52.7 million |
| 2 | India | 18.7 million |
| 3 | United States | 14.5 million |
| 4 | Turkey | 11.8 million |
| 5 | Egypt | 8.3 million |
| 6 | Iran | 5.97 million |
| 7 | Italy | 5.62 million |
| 8 | Spain | 4.9 million |
| 9 | Brazil | 4.3 million |
| 10 | Mexico | 3.53 million |
| Rank | Country | Export in Dollar | Percentage of total Export |
| 1 | Mexico | $2.1 billion | 25.10% |
| 2 | Netherlands | $1.6 billion | 19.00% |
| 3 | Spain | $1.1 billion | 12.60% |
| 4 | Morocco | $509.2 million | 6.10% |
| 5 | Canada | $373.1 million | 4.40% |
| 6 | France | $355.1 million | 4.20% |
| 7 | United States | $352 million | 4.20% |
| 8 | Belgium | $287.9 million | 3.40% |
| 9 | Jordan | $255.5 million | 3.00% |
| 10 | Turkey | $239.9 million | 2.90% |
| Rank | State | Area (000 HA) | Production in (000 MT) | % Share of Production |
| 1 | Andhra Pradesh | 296.3 | 5926.2 | 35.22 |
| 2 | Karnataka | 51.2 | 1756.7 | 10.44 |
| 3 | Orrisa | 96.6 | 1367.2 | 8.13 |
| 4 | Maharashtra | 52 | 738 | 4.39 |
| 5 | West Bengal | 54.1 | 54.1 | 6.32 |
| 6 | Bihar | 46.8 | 1056.2 | 6.28 |
| 7 | Gujarat | 38.8 | 978.4 | 5.81 |
| 8 | Chhatishgarh | 42.9 | 627.9 | 3.73 |
| 9 | Tamilnadu | 27.2 | 580.6 | 3.45 |
| 10 | Jharkhand | 22.3 | 401.6 | 2.39 |
Connect with us